History
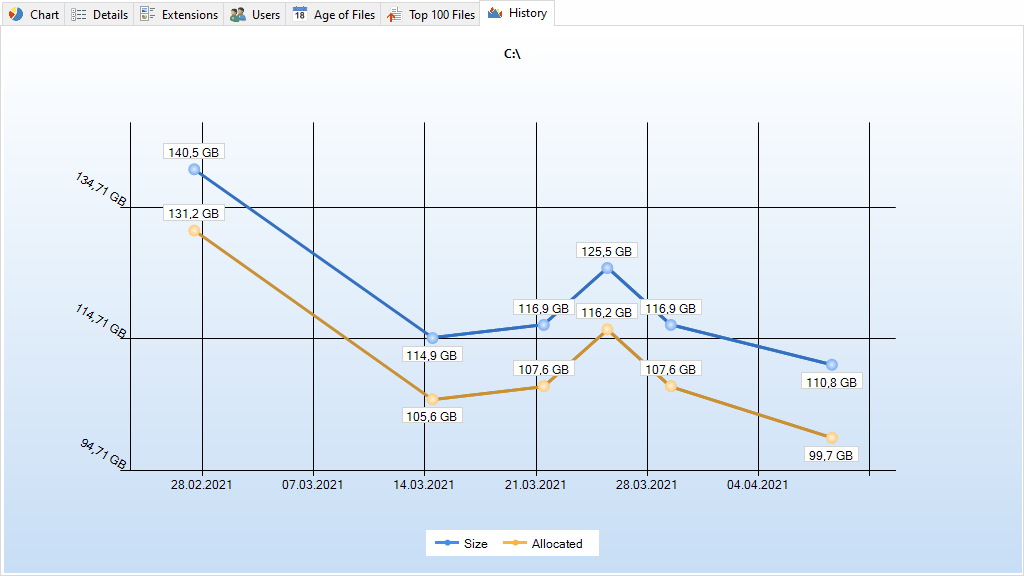
In the History view you can see line charts visualizing the size development of the selected root folder.
After each scan the size, allocated space, and number of files of the root folder are stored automatically in an XML file in the users profile of the currently logged-in user.
These sizes are used to create this view. As a result the shown interval and frequency depends on the scans you have performed for this root before.
Note
By default, only scans of the same path and the same exclude filters will be displayed in the history, since a common base is needed to compare scans. Using the Ignore scan filter option allows to include scans of the same path, but with differing exclude filters.

Context tab
Use the “History” tab to customize the appearance of the chart, to export the chart to a file, and to manage history data.

The following commands are available on the “History” tab:
Export chart
Save the current chart as graphic file.
Email
Export the current chart and send it via email. You can configure your email settings in options dialog.
Copy Chart to Clipboard
Copy the current chart to the clipboard, to paste it into other applications.
Print right pane
Print the current chart.
Manage history data
Provides actions for the export/import and purge of history data. Additionally allows choosing a new storage location for the data.
Show zero point
Show zero point as minimum value in the chart.
Show “Size/Allocated” series
Do not only show the currently selected value (size/allocated), but also the respective other one
Ignore scan filter
If activated, all scans of the current path will be included with the chart, regardless of the filters used for each of the scans.
Show average series
Show or hide a line indicating the average trend for this chart.
Show labels
Show info boxes (size values/number of files) in the chart.
Show total diskspace
Show or hide a horizontal line showing the total diskspace.
Equalize chart
Defines wether the chart is displayed interpolated or exact.
Color gradient as background
Toggle the gradient in the background of the chart.
Show data points
Show or hide points on line chart.
Zoom in
Zoom in on the chart
Zoom out
Zoom out on the chart
Zoom 100%
Reset zoom to 100%
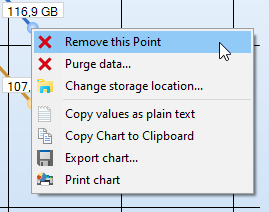
Remove data point
Using the context menu of the History view, you can remove single data points. Please note that this requires the “Show data points” option to be enabled (see above).
