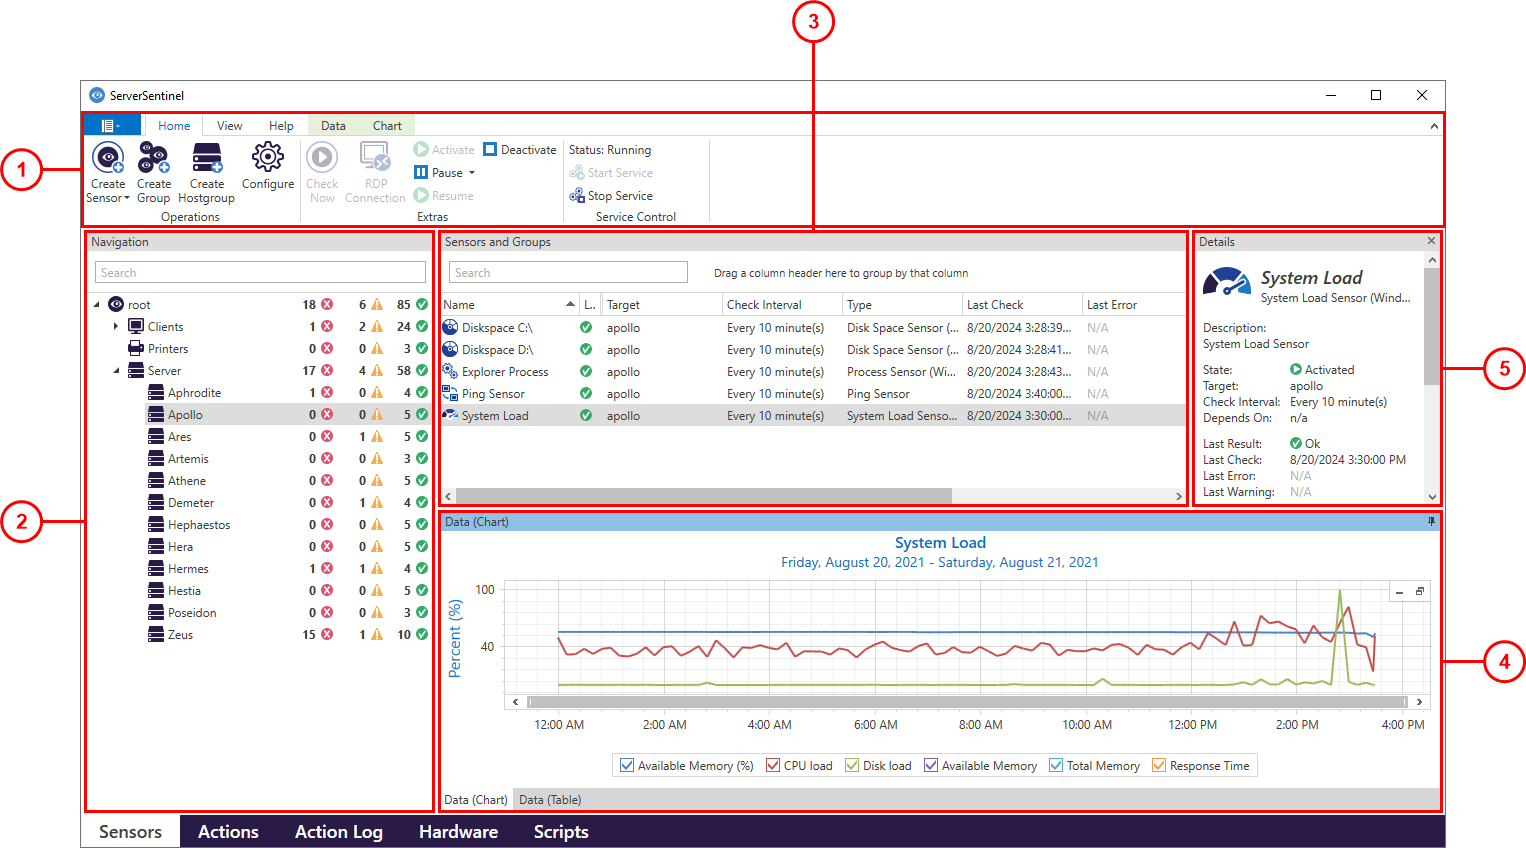
1.Ribbon |
The ribbon provides access to various functions of the application. For example the possibility to to create, edit or delete sensors or groups. The topic Sensor View Ribbon contains detailed information about the available functions accessible in this view. |
2.Navigation |
Displays the groups and the counters for the statuses of the sensors in them. |
3.Sensors and Groups |
Displays the sensors and groups with their common properties like name, state, target etc. You can also sort them by name, check interval, target etc. For further information regarding the view capabilities see the Content Presenter topic. |
4.Data (Chart) |
Shows the collected data in a graphic overview as a chart with various display options such as time, size etc. |
4.Data (Table) |
Shows the collected data as raw data in a table. For further information regarding the view capabilities see the Content Presenter topic. |
5.Details |
Shows the most important details about the selected sensor or group. |
Individual Customization
The separate areas (2-5) can be customized in their size and arrangement.
Change size
The size of the separate areas can be changed by moving the separater which is between the different areas.
Change arrangement
The arrangement of the separate areas can be changed by moving an area using its title bar per drag'n'drop.