Charts
SpaceObServer is able to visualize folder information in several different types of charts. The information is based on the currently active view mode of SpaceObServer. There are three basic types of charts, namely:
Context tab: Chart
Please note: a context tab will be activated when the Chart view is selected. It allows you to manipulate the charts in several ways, for example zooming, turning on or off the grid lines, switching between 2D and 3D mode, changing colors, etc. Using the tab, you can also copy the current chart to the clipboard or save it as a file.
Some elements are available exclusively for certain types of charts (e.g. “Level of Details” for “Tree Map” chart only).
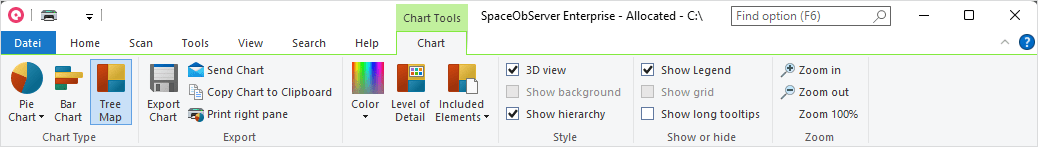
The following commands are available on the “Chart” tab:
Pie Chart Switches to pie chart view.
Bar Chart Switches to bar chart view.
Tree Map Switches to hierarchical chart view.
Export Chart Saves the current chart as a graphic file.
Send Chart Exports the current chart and send it via email. You can configure your email settings in options dialog.
Copy Chart to Clipboard Copies the current chart to the clipboard (can be pasted in other applications).
Print right pane Prints the current chart.
Color Use the color picker to choose a color for the chart below: select a color, then click on the part of the pie the color should be applied to. In order to reset the chart colors, right click into the chart and choose “Reset Chart Colors” from the context menu.
Level of detail Changes the detail level of the tree map.
Included Elements Changes the included elements in the tree map (single files, extensions, file type groups).
3D view Toggles the 3D and 2D view of the chart.
Show background Toggles the gradient in the background of the chart.
Show hierarchy Toggles the hierarchical visualization in the tree map,
Show Legend (Pie chart, Tree map only) Shows a legend in this chart.
Show Free Space (Pie chart only) Shows the free space of a drive as additional slice.
Show labels (Bar chart only) Shows short information for all segments of the chart.
Show grid (Bar chart only) Shows grid lines for this chart.
Show long tooltips Hovering segments of a chart can show detailed information. Use this option to switch between simple and detailed tooltips.
Zoom in Zooms in on the chart.
Zoom out Zooms out of the chart.
Zoom 100% Resets the zoom level to default (100%).
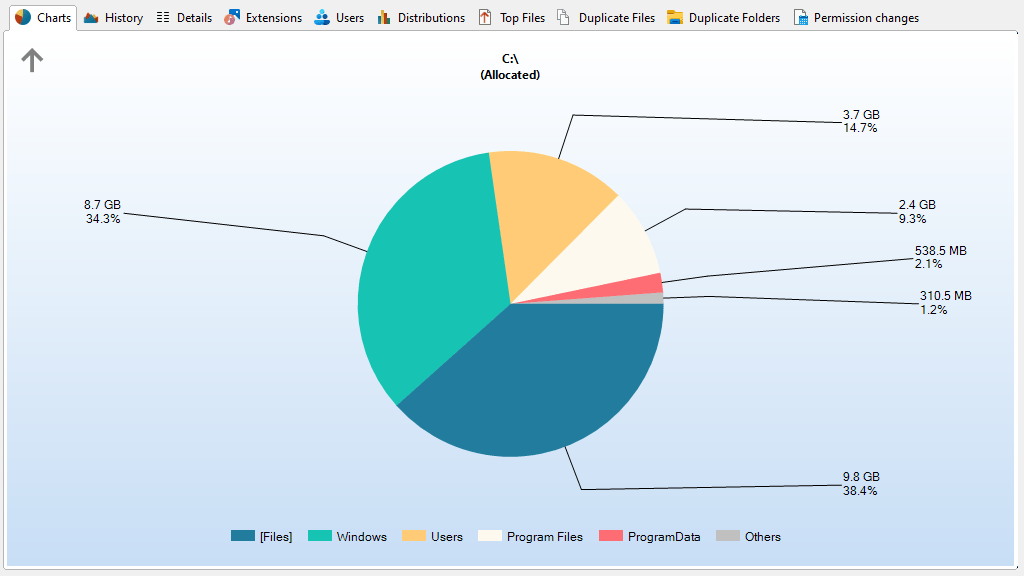
Pie Chart The Pie Chart shows the relative portions of each subfolder of the currently selected item in the Directory Tree.
The diagram contains the name of each folder, its size (or allocated space, or number of files; for more information please see view modes), and its percentage value. Small folders may be summarized in a slice named “Other”.
If a root of any drive is displayed in a pie chart and you have switched to the “Allocated Space” mode, the free space of this drive will also be displayed as one slice of the pie. This behaviour can be switched on or off in the options menu. The pie chart shows the free space as one slice among the others and calculates the percentage appropriately (relatively to the others), so the percent value might differ from the “% Free” value of the drive if SpaceObServer didn’t see all files.
Hovering over a slice will show detailed information about the corresponding folder, double clicking will change into the selected folder.
Double-clicking on a slice will show the pie chart view for the selected folder. In case the clicked slice represents a file, it would be executed. Right click a slice in order to perform file operations like delete, copy, paste, properties etc. To manage several folders at once hold the shift key while selecting the desired segments in chart.
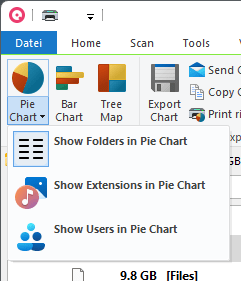
Please note that the Pie Chart not only visualizes the sizes of each subfolder of the currently selected item in the Directory Tree, but also the distribution of file extensions and even the file and directory owners (user statistics). To change the type of the Pie Chart, please click on the drop-down arrow right beside the caption of the Ribbon button (see image below).
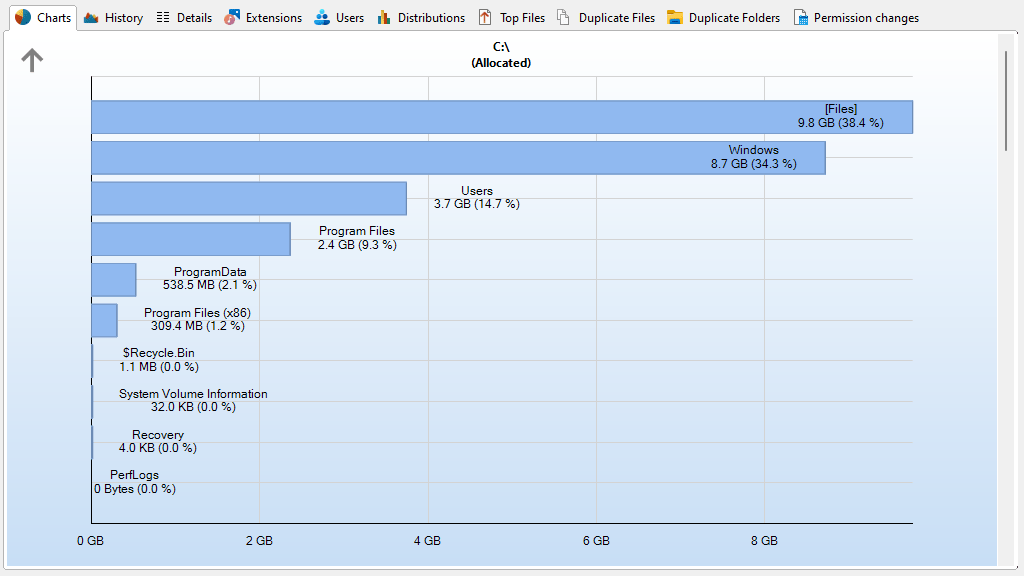
Bar Chart The Bar Chart visualizes folder sizes in form of horizontal bars. Grid lines in the background of the chart allow for easy determination of folder sizes and comparison of each folder in relation to other folders on the same directory level. As with the pie chart, hovering over a bar will call up more detailed information about the corresponding folder. Double-clicking on a bar will show the bar chart view for the selected folder.
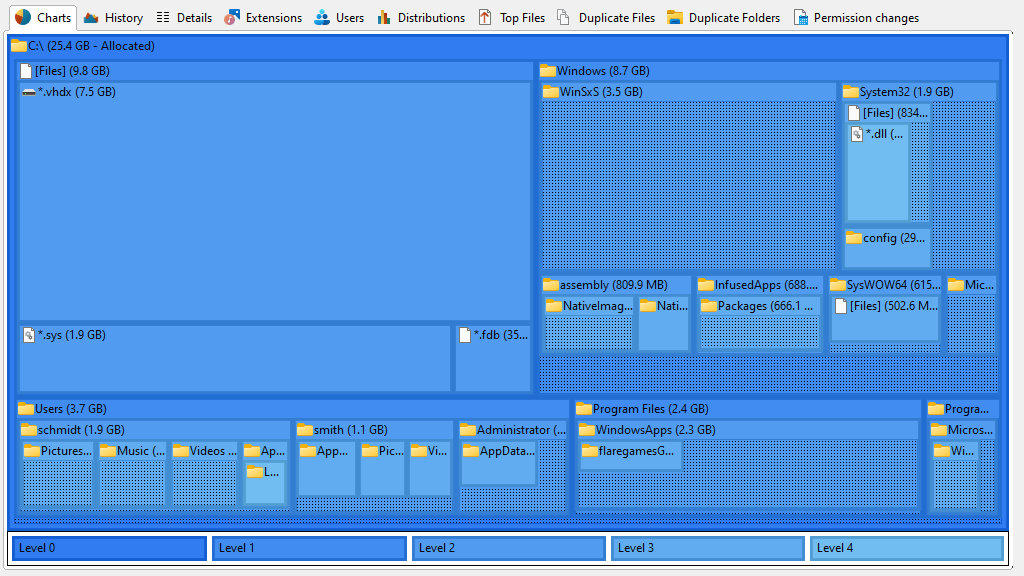
Tree Map The Tree Map is a hierarchical chart that is able to visualize the sizes of each subfolder (not only direct child folders) of a selected directory branch.
Each folder is shown as a rectangle. The area of the rectangle represents the size of the corresponding folder. The rectangles of subfolders are located inside the rectangle of their parent folder. If a folder has no subfolders and the file extensions statistics was activated during the scan, the file types are now shown as subitems.
The color of the rectangle face indicates the directory level. The colors range from purple (top level directories) to bright yellow (directories with a deep file system level). These colors can be adjusted using the color picker in the context tab. The shown rectangles must have a minimum size to be displayed. You can customize this minimum value using the Level of detail track bar in the context tab. If this value is small, the chart might look very complex and confusing.
If you place the mouse cursor over the chart, you will see a tooltip containing information about the directory the cursor hovers over. Double-clicking on one of the rectangles will navigate to the corresponding directory in the Directory Tree. Drag and drop operations are supported in the tree map.